
Happy and flourishing? Hedonic and eudemonic wellbeing
Hedonism (happiness) and eudemonia (flourishing) are both important components of individual wellbeing. The European Social Survey (ESS) shows how these related but distinct dimensions of wellbeing vary across Europe.
Introduction
Questions regarding what exactly wellbeing consists of can be traced back to the philosophical debates in ancient Greece (Waterman, 1993). The hedonic school of thought, exemplified by Epicurus, believed a good life to be filled with happiness, and little pain. Aristotle dismissed this narrow conception, and instead proposed eudemonia, or flourishing, living in accordance with your true self, as a way to lead a good life (Keyes and Annas, 2009).
These distinct views on the nature of wellbeing have survived the ages, and still exist in contemporary research on wellbeing. Through economics, Bentham’s hedonic calculus, or the idea that the utility of everything can be calculated, has found its way into contemporary policy debates with subjective wellbeing as the ultimate outcome (Dolan and Peasgood, 2008). Hedonic conceptions of wellbeing, such as life satisfaction and happiness, are now well-known ways of investigating wellbeing. Eudemonic wellbeing is closer to current psychological constructs, such as Maslow’s hierarchy of needs, which names self-development and autonomy as higher order needs, which emerge after more basic needs such as food, shelter and security are fulfilled (Ryff and Keyes, 1995). Another conceptualisation of what eudemonic wellbeing entails can be found in the capabilities approach (Nussbaum and Sen, 1993), which states that wellbeing is about the potential to choose as well as the actual opportunities taken. So while hedonic wellbeing is about feelings and the evaluation of one’s situation, eudemonic wellbeing is more about being in control and having a choice. The existence of different forms of wellbeing that are not reducible to one basic form has been recently discussed in academic literature on wellbeing (e.g. Clark and Senik, 2011; Kashdan, Biswas-DIener and King, 2008; Vanhoutte, 2014).
Although the philosophical conceptions of wellbeing may come from different angles, there is a lot to be gained from thinking about them alongside one another. Large scale surveys such as the European Social Survey (ESS) which measure different aspects of wellbeing allow us to do this. We can empirically evaluate the extent to which there is in fact a distinction between hedonic and eudemonic wellbeing as experienced by individuals in society today. We can also look at whether and how levels of these two types of wellbeing vary across countries and between different sub-groups of the population within a country. Having reliable data that can distinguish between different conceptions of wellbeing in this way is beneficial to policymakers seeking to understand and address differences in wellbeing within society. Cross-national data such as the ESS are particularly useful in providing a comparative European perspective for policy.
Combining the theoretical insights discussed above with data from the rotating module on ‘Personal and Social Wellbeing’ fielded in Round 6 (2012/2013) of the ESS, this contribution aims to construct a multidimensional measure of wellbeing that reflects both eudemonic and hedonic aspects. It will go on to investigate differences in these two forms of wellbeing across 29 European countries and between men and women.
Meet the author
Bram Vanhoutte
Research Associate at the Cathie Marsh Institute for Social Research, University of Manchester, UK
Using the ESS to investigate different forms of wellbeing
Round 3 and Round 6 of the ESS fielded a module of questions on ‘Personal and Social Wellbeing’ capturing both hedonic and eudemonic aspects of wellbeing using multiple items. This allows researchers, analysts and policymakers to distinguish between happiness and flourishing (Huppert et al., 2009; Huppert and So, 2013). Here, we use the latest data from Round 6 of the ESS that was fielded in 29 countries.1 We focus on seven items which together capture aspects of both hedonic and eudemonic personal wellbeing. These are described in Figure 1. The module also contains a number of other measures of wellbeing including measures of affective wellbeing, psychological resources such as optimism and social wellbeing – some of which are discussed in other contributions on this site – but these are beyond the scope of this particular analysis.
Figure 1 : ESS Round 6 (2012/2013) questions included in the analysis
Hedonic Wellbeing
B20. All things considered, how satisfied are yo uwith your life as a whole nowadays? Please answer using this card, where ) means extremely dissatisfied and 10 means extremely satisfied.
C1. All things Taking all things together, how happy would you say you are?
| Extremely dissatisfied | Extremely satisfied | |||||||||
| 00 | 01 | 02 | 03 | 04 | 05 | 06 | 07 | 08 | 09 | 10 |
Eudemonic Wellbeing
B16. I feel I am free to decide for myself how to live my life.
D17. In my daily life I get very little chance to show how capable I am.
D18. Mos days I feel a sense of accomplishment from what I do.
D23. I generally feel that what I do in my life is valuable and worthwile
| Agree strongly | Agree | Neither agree nor disagree | Disagree | Disagree strongly |
| 1 | 2 | 3 | 4 | 5 |
D35. To what extent do yo ufeel that you have a sense of direction in your life?
| Not at all | Completely | |||||||||
| 00 | 01 | 02 | 03 | 04 | 05 | 06 | 07 | 08 | 09 | 10 |
Since wellbeing is a latent, unobserved characteristic, measured indirectly through multiple items, we use factor analysis to construct the measures of wellbeing to be used in analysis. As we explicitly want to test if we can meaningfully speak about hedonic and eudemonic wellbeing as different forms of wellbeing, we use a technique known as confirmatory factor analysis (see Brown, 2006) to test if our data fit better into our assumed two-dimensional model instead of a one-dimensional model.
Findings
Firstly we test to see if the data confirm the dual nature of wellbeing implied by theory, i.e. whether we can meaningfully distinguish between two different dimensions of wellbeing. We do this by comparing the fit of a two-factor model (which assumes that the data are measuring two distinct concepts) vs. a one-factor model (which assumes that all our measures of wellbeing are capturing the same underlying theoretical concept). Comparing how well the two models fit the data suggests a very good fit between our theoretical model and the ESS Round 6 data.2 In our two-factor model, the items referring to happiness and satisfaction load on (i.e. relate to) a hedonic dimension, while all other items load on a eudemonic dimension. The correlation between both factors is high (ρ=0.65) – meaning that people with a good score in terms of hedonic wellbeing also tend to score high on eudemonic wellbeing – but the two concepts are distinct from one another (see also e.g. Clark and Senik, 2011).
Having demonstrated that there is an important distinction between hedonic and eudemonic wellbeing we next investigate differences in individuals’ levels of both forms of wellbeing across countries. Figure 2 depicts the country mean for both types of wellbeing. The factor scores used to measure the two wellbeing dimensions are calculated over all respondents in ESS Round 6, with a mean of zero and a standard deviation of one; some countries have lower than average wellbeing compared to others (indicated by negative scores) whilst others have higher than average wellbeing (indicated by positive scores). It is clear from Figure 2 that wellbeing, especially hedonic wellbeing, does vary across countries. Hedonic wellbeing tends to be higher than average in Scandinavia and lower than average in parts of southern and eastern Europe. Second, although as shown above there is a distinction between the two types of wellbeing, in nearly all countries both forms of wellbeing seem to go in the same direction of the mean at the country level; countries that do well in terms of hedonic wellbeing also do well on eudemonic wellbeing.
Countries that do well in terms of
hedonic wellbeing also do well in eudemonic wellbeing
Figure 2: Hedonic and eudemonic wellbeing across Europe by country
Data source: ESS Round 6 (2012/2013). Design weights applied.
It is important to keep in mind that these country level findings hide a significant amount of within-country variation. Analysis shows that that only 15% of the variation in hedonic and 7% of the variation in eudemonic wellbeing can be explained by the country with the remainder being explained at the individual level.3 Looking at variation in wellbeing by a range of socio-demographic characteristics (e.g. gender, age, education, employment, marital status etc.) both within and between countries can provide further insights into the distribution of wellbeing across populations. Here we examine if there is a gender gap in hedonic and eudemonic wellbeing and whether the size of this gap varies across countries.
Figure 3 shows the gender gap in hedonic and eudemonic wellbeing across countries. A positive value indicates that men score higher on wellbeing, while a negative value indicates that on average women have a higher wellbeing score than men. There is a statistically significant gender gap in wellbeing in five countries (Czech Republic, Portugal, Estonia, Israel and Ukraine) for hedonic wellbeing and in two countries (Portugal and Iceland) for eudemonic wellbeing. The gender differences are, however, relatively small in most countries. Interestingly, the gender gap goes in different directions for different countries. While men in the Czech Republic and Portugal have significantly higher hedonic wellbeing than women, hedonic wellbeing is higher for women in Estonia, Israel and Ukraine. Eudemonic wellbeing is higher for men in Portugal, but higher for women in Iceland. Interpreting the gender gap in wellbeing at the country level is not straightforward: gendered expectations are culturally sensitive, and at the same time there are large differences across countries in the gender distribution of resources that produce wellbeing. For example, having a job might be a more important determinant of wellbeing for men than women in one country, while it might carry similar importance for both sexes in another. Further analysis of the gender gap in different types of wellbeing can be found in the “Drivers of wellbeing” section of this site.
Analysis shows that that only
15%
of the variation in hedonic and
7%
of the variation in eudemonic wellbeing can be explained by the country with the remainder being explained at the individual level
Figure 3: Gender gap in hedonic and eudemonic wellbeing by country
Data source: ESS Round 6 (2012/2013). Design weights applied.
Conclusion
Analysis of data from Round 6 of the ESS reveals that hedonic and eudemonic wellbeing are two distinct concepts reflecting different theoretical aspects of subjective wellbeing. These two distinct concepts are, however, highly correlated and cross-national comparison shows that most countries reporting high hedonic wellbeing also report high levels of eudemonic wellbeing. There is more variation at the country level in hedonic wellbeing than in eudemonic wellbeing, but the large majority of variation in both forms of wellbeing is at the individual level. Our analysis, for example, demonstrates that there are gender differences in both types of wellbeing in a number of countries. Analysing how individual socio-demographic characteristics are related to different levels of hedonic and eudemonic wellbeing can provide useful insights for policymakers seeking to understand and address differences in wellbeing within society.
You can find out more about the difference between hedonic and eudemonic wellbeing and how both dimensions can be explored using ESS data in the following publications:
Vanhoutte, B. (2014)
‘The Multidimensional Structure of Subjective Well-Being In Later Life’. Journal of population ageing, 7, pp. 1–20.
Huppert, F.A. and So, T. T. (2013)
‘Flourishing across Europe: Application of a New Conceptual Framework for Defining Well-being’. Social Indictors Research, 110 (3), pp. 837-861.
Clark, A. E. and Senik, C. (2011)
‘Is Happiness Different from Flourishing? Cross-country Evidence from the ESS’. PSE Working Papers, 2011(4).
Ariely, G. and Davidov, E. (2011)
‘Assessment of Measurement Equivalence with Cross-National and Longitudinal Surveys in Political Science’. European Political Science, 1, pp. 1–15.
Brown, T. A. (2006)
Confirmatory Factor Analysis for Applied Research. New York: The Guilford Press.
Clark, A. E. and Senik, C. (2011)
‘Is Happiness Different from Flourishing? Cross-country Evidence from the ESS’. PSE Working Papers, 2011(4).
Dolan, P. and Peasgood, T. (2008)
‘Measuring Well-Being for Public Policy : Preferences or Experiences?’ Journal of Legal Studies, 37(2), pp. 5–31.
Hu, L. and Bentler, P.M. (1999)
‘Cutoff Criteria for Fit Indexes in Covariance Structure Analysis: Conventional Criteria versus New Alternatives’. Structural Equation Modeling: A, 6(1), pp.1 –55.
Huppert, F.A., Marks, N., Clark, A., Siegrist, J., Stutzer, A., Vitters, J., Wahrendorf, M. (2009)
‘Measuring Well-being across Europe: Description of the ESS Well-being Module and preliminary findings’. Social Indicators Research, 91(123), pp. 301–315.
Kashdan, T.B., Biswas-Diener, R., King, L. A. (2008)
‘Reconsidering Happiness: The Costs of Distinguishing between Hedonics and Eudaimonia’. The Journal of Positive Psychology, 3(4), pp. 219–233.
Keyes, C.L.M. and Annas, J. (2009)
‘Feeling Good and Functioning Well: Distinctive Concepts in Ancient Philosophy and Contemporary Science’. Journal of Positive Psychology, 4(3), pp. 197–201.
Nussbaum, M.C. and Sen, A.K. (ed) (1993)
The Quality of Life. Oxford: Oxford University Press.
Ryff, C.D. and Keyes, C.L.M. (1995)
‘The Structure of Psychological Well-being Revisited’. Journal of personality and social psychology, 69(4), p. 719.
Vanhoutte, B. (2014)
‘The Multidimensional Structure of Subjective Well-Being In Later Life’. Journal of population ageing, 7, pp. 1–20.
Waterman, A.S. (1993)
‘Two Conceptions of Happiness: Contrasts of Personal Expressiveness (Eudaimonia) and Hedonic Enjoyment’. Journal of Personality and Social Psychology, 64(4), pp. 678–691.
- Countries included in the analysis: Albania, Belgium, Bulgaria, Cyprus, Czech Republic, Denmark, Estonia, Finland, France, Germany, Hungary, Iceland, Ireland, Israel, Italy, Kosovo, Lithuania, Netherlands, Norway, Poland, Portugal, Russia, Slovakia, Slovenia, Spain, Sweden, Switzerland, UK, Ukraine. In total about 54,600 respondents; 51,859 cases were included in the analysis after excluding cases with missing data on key indicators.
- We determine which model fits best by looking at fit indices such as the RMSEA (lower is better fit, with .06 being a good fit) and CFI (higher is better fit, with .95 being a good fit). For more information on the fit indices used to determine model fit see Hu and Bentler, 1999). As it would stretch beyond the aims of this contribution, we do not test the assumption of measurement invariance. Measurement invariance means that our measure functions in a similar way across all nations, and does not introduce bias (Ariely and Davidov, 2011)
- A multilevel model was used to examine the nested structure of our data (individuals nested within countries) and identify how much of the variation in wellbeing observed is present at the country level vs. the individual level.
Wellbeing: A Multidimensional Concept
The wide range of wellbeing measures included in Round 6 of the European Social Survey (ESS) provides a nuanced picture of the different dimensions of personal and social wellbeing. The data allow for a detailed consideration of how experiences of wellbeing vary both across countries and between different subgroups of the population within countries.
Introduction
Improving our overall experience of life, i.e. improving our wellbeing, is an aim that will appeal to most people – especially when wellbeing is understood to refer to something more than happiness alone. Many would argue that government has a duty to prioritise creating the societal conditions which enable citizens to achieve high wellbeing (Diener and Seligman, 2004). If individuals and policymakers are interested in understanding what those conditions should be, it is useful first to understand peoples’ current experiences of their lives, and to measure these alongside the range of factors which might have some influence on those experiences. Only with such measurement can we begin to understand which features are most likely to contribute to higher wellbeing, and to identify groups within society which might benefit most from interventions designed to increase wellbeing. But how can such a complex concept as wellbeing be measured systematically?
A common approach is to use surveys to ask people to evaluate their overall experience of life (Diener et al., 1985). This often takes the form of asking questions such as: “taking all things together, how happy would you say you are?” or “all things considered, how satisfied are you with your life as a whole?” However, several studies now suggest that, whilst offering a fairly good overview of wellbeing, using a single, catch-all measure might also hide some of the interesting details that a more multidimensional approach can reveal (Michaelson et al., 2009; OECD, 2013; Seligman, 2011).
The ‘Personal and Social Wellbeing’ module included in Round 6 (2012/2013) of the European Social Survey (ESS) includes 39 questions specifically designed to measure the different possible dimensions of wellbeing, enabling a much more nuanced understanding of the concept both within and between countries.
Exploring the different dimensions of wellbeing across countries
Using a combination of theoretical models and statistical analysis, we grouped 35 of the items included in the Personal and Social Wellbeing ESS module into six distinct wellbeing dimensions.
Meet the authors
Karen Jeffrey
Researcher, New Economics Foundation, UK
Saamah Abdallah
Senior Researcher, New Economics Foundation, UK
Using existing theoretical models about the different aspects of wellbeing and social relationships (Michaelson et al., 2009; OECD, 2013; Scrivens and Smith, 2013), we first identified six major wellbeing dimensions. We then used a statistical technique called principal component analysis to map items included in the Personal and Social Wellbeing module to each of those dimensions. Table 1 details the Personal and Social Wellbeing module items included within each wellbeing dimension.
| Wellbeing Dimension | ESS Survey Item |
|---|---|
| Evaluative wellbeing | B20 How satisfied with life as a whole |
| C1 How happy are you | |
| Emotional wellbeing | D11 Felt sad, how often past week |
| D5 Felt depressed, how often past week | |
| D10 Enjoyed life, how often past week | |
| D8 Were happy, how often past week | |
| D14 You felt anxious, how often past week | |
| D15 You felt calm and peaceful, how often past week | |
| Functioning | D16 Free to decide how to live my life |
| D17 Little chance to show how capable I am | |
| D18 Feel accomplishment from what I do | |
| D31 Interested in what you are doing | |
| D32 Absorbed in what you are doing | |
| D33 Enthusiastic about what you are doing | |
| D23 Feel what I do in life is valuable and worthwhile | |
| D35 Have a sense of direction | |
| D2 Always optimistic about my future | |
| D25 There are lots of things I feel I am good at | |
| D3 In general feel very positive about myself | |
| D4 At times feel as if I am a failure | |
| D19 When things go wrong in my life it takes a long time to get back to normal | |
| D30 Deal with important problems | |
| Vitality | D6 Felt everything did an effort, how often past week |
| D7 Sleep was restless, how often past week | |
| D12 Could not get going, how often past week | |
| D13 Had lot of energy, how often past week | |
| Community wellbeing | A3 Most people can be trusted / can’t be too careful |
| A4 People try to take advantage | |
| A5 Most of the time people are helpful | |
| D21 Feel people in local area help one another | |
| D27 Feel close to the people in local area | |
| Supportive relationships | C3 How many with whom you can discuss intimate matters |
| D29 Feel appreciated by those you are close to | |
| D36 Receive help and support | |
| D9 Felt lonely, how often past week |
The six wellbeing dimensions are:
- Evaluative wellbeing, which covers individuals’ overall estimations of how well their life is going, including feeling satisfied with life and feeling happy overall.
- Emotional wellbeing, which includes positive day-to-day feelings such as happiness and enjoyment of life, and lack of negative feelings such as anxiety and depression.
- Functioning, which includes feelings of autonomy, competence, engagement, meaning and purpose, self-esteem, optimism and resilience.
- Vitality, which includes sleeping well, feeling energised and feeling able to face the challenges that life presents.
- Community wellbeing, which covers an individual’s feelings about the community in which they live, including trust in other people, feeling supported by members of the community, and experiencing a sense of neighbourliness.
- Supportive relationships, which relates to individuals feeling that there are people in their lives who offer support, companionship, appreciation, and with whom they can discuss intimate matters.
For each wellbeing dimension, we then created an index which combines the scores for all the survey items included within that wellbeing dimension into a single score to represent the dimension as a whole.
The summary scores for each dimension were derived by, first, standardising the responses to each item included within the index by calculating a z-score for each question. Calculating z-scores involves adjusting the value of scores for each question so that they are comparable with the scores of other questions, where answers given are in different ranges. A z-score of zero would represent a value that is equal to the mean, and a z-score of one or negative one, would represent a distance from the mean of one standard deviation. We then averaged the z-scores of all questions included in a given wellbeing dimension to produce a single, standardised score to represent that dimension.
The wellbeing dimension scores for each of the 29 countries that took part in Round 6 of the ESS are displayed in Figure 1.1 Results for different countries can be displayed by selecting or deselecting from the list of countries shown next to the chart. We see that where respondents within a country report high scores on one wellbeing dimension, they tend to also report high scores on the other wellbeing dimensions (for example, in Switzerland); whilst countries where respondents report lower scores on one wellbeing dimension, also tend to report lower scores on the other wellbeing dimensions (for example, in Ukraine). However, this pattern is not always found. For example, in Hungary, whilst people report quite low wellbeing across most of the dimensions, they report a much higher score for the community wellbeing dimension. Similarly, in Russia, the average score for the functioning dimension is much lower than the scores for each of the other five dimensions.
Figure 1: Average score on different dimensions of wellbeing by country
Data source: ESS Round 6 (2012/2013). Post-stratification weights applied.
We can see from this analysis that where citizens report experiencing high or low wellbeing according to one dimension, this usually, but crucially not always, predicts similar scores according to the other wellbeing dimensions.
Where respondents within a country report high scores on one wellbeing dimension, they tend to also report high scores on the other wellbeing dimensions
Exploring the dimensions of wellbeing across age and income groups
As well as comparing the overall level of wellbeing on different dimensions within a country, it is also important to consider how that wellbeing is distributed across the population and whether there are notable inequalities in wellbeing between different groups. The ESS contains a wide range of demographic background variables allowing for a detailed analysis of how different population sub-groups score on the different wellbeing dimensions.
Differences by age group
Figure 2 shows the average wellbeing dimension scores for ESS respondents broken down by age group. This analysis includes respondents from all 29 of the countries included in the survey except Russia.2
It demonstrates that the relationship between age and wellbeing varies by dimension. For example, whilst vitality and emotional wellbeing decline steadily with age, functioning scores remain fairly consistent across age groups, before declining in the oldest age group. Supportive relationships and evaluative wellbeing scores are both at their lowest amongst the middle age group. Interestingly, the community wellbeing scores show a very different trend, increasing fairly consistently and steeply with age.
Vitality
and
emotional wellbeing
decline steadily with age
Figure 2: Average score on different dimensions of wellbeing by age group
Data source: ESS Round 6 (2012/2013). Post-stratification and population weights applied.
If we group countries into broad geographical regions we see that the scores on the various wellbeing dimensions follow broadly similar trends by age across the different regions. A notable difference between regions is that in south-eastern, central and eastern Europe, scores on the functioning dimension peak earlier than in the other regions, and then decline more steeply with age.
| Age group | Emotional wellbeing | Functioning | Community wellbeing | Supportive relationships | Evaluative wellbeing | Vitality | |
|---|---|---|---|---|---|---|---|
| UK & Ireland | <25 | 0.20 | 0.10 | -0.17 | 0.06 | 0.32 | 0.11 |
| 25-34 | 0.07 | 0.06 | -0.16 | 0.00 | 0.12 | -0.02 | |
| 35-49 | 0.06 | 0.02 | -0.05 | -0.03 | 0.05 | -0.07 | |
| 50-64 | 0.10 | 0.06 | 0.01 | 0.03 | 0.14 | -0.12 | |
| 65-74 | 0.18 | 0.18 | 0.23 | 0.19 | 0.43 | -0.11 | |
| >75 | 0.15 | 0.08 | 0.19 | 0.14 | 0.44 | -0.21 | |
| Total | 0.12 | 0.08 | -0.01 | 0.05 | 0.21 | -0.07 | |
| Scandinavia | <25 | 0.25 | 0.13 | 0.06 | 0.23 | 0.51 | 0.04 |
| 25-34 | 0.26 | 0.21 | -0.02 | 0.27 | 0.48 | 0.01 | |
| 35-49 | 0.27 | 0.21 | 0.14 | 0.22 | 0.46 | 0.03 | |
| 50-64 | 0.32 | 0.22 | 0.15 | 0.19 | 0.51 | 0.00 | |
| 65-74 | 0.37 | 0.20 | 0.21 | 0.23 | 0.61 | -0.01 | |
| >75 | 0.26 | 0.03 | 0.18 | 0.16 | 0.53 | -0.11 | |
| Total | 0.29 | 0.19 | 0.12 | 0.22 | 0.51 | 0.00 | |
| Southern Europe | <25 | 0.03 | -0.04 | -0.14 | -0.03 | 0.15 | -0.04 |
| 25-34 | 0.01 | 0.00 | -0.10 | -0.03 | 0.08 | -0.05 | |
| 35-49 | -0.06 | 0.00 | 0.00 | -0.02 | 0.05 | -0.02 | |
| 50-64 | -0.18 | -0.04 | -0.02 | -0.12 | -0.13 | -0.12 | |
| 65-74 | -0.15 | -0.01 | 0.04 | 0.00 | -0.03 | -0.07 | |
| >75 | -0.23 | -0.04 | 0.19 | -0.06 | 0.00 | -0.13 | |
| Total | -0.10 | -0.02 | -0.01 | -0.05 | 0.00 | -0.07 | |
| Western Europe | <25 | 0.22 | 0.11 | -0.03 | 0.27 | 0.42 | 0.07 |
| 25-34 | 0.13 | 0.12 | -0.11 | 0.19 | 0.21 | 0.08 | |
| 35-49 | 0.08 | 0.13 | -0.02 | 0.14 | 0.18 | 0.12 | |
| 50-64 | 0.09 | 0.14 | 0.06 | 0.16 | 0.14 | 0.08 | |
| 65-74 | 0.11 | 0.16 | 0.09 | 0.16 | 0.25 | 0.02 | |
| >75 | 0.02 | 0.07 | 0.16 | 0.12 | 0.21 | 0.00 | |
| Total | 0.10 | 0.13 | 0.03 | 0.17 | 0.22 | 0.07 | |
| Central & eastern Europe | <25 | 0.21 | 0.06 | -0.01 | 0.09 | 0.24 | 0.15 |
| 25-34 | 0.14 | 0.12 | -0.10 | 0.05 | 0.11 | 0.10 | |
| 35-49 | 0.04 | 0.06 | -0.04 | -0.03 | -0.05 | 0.04 | |
| 50-64 | -0.14 | -0.01 | -0.03 | -0.07 | -0.18 | -0.07 | |
| 65-74 | -0.33 | -0.15 | -0.05 | -0.11 | -0.26 | -0.22 | |
| >75 | -0.37 | -0.28 | 0.03 | -0.07 | -0.12 | -0.23 | |
| Total | -0.05 | 0.00 | -0.04 | -0.03 | -0.05 | -0.02 | |
| South-eastern Europe | <25 | -0.02 | 0.05 | -0.10 | 0.09 | -0.15 | 0.19 |
| 25-34 | -0.05 | 0.08 | -0.10 | 0.09 | -0.44 | 0.15 | |
| 35-49 | -0.23 | -0.03 | -0.08 | -0.01 | -0.62 | 0.07 | |
| 50-64 | -0.39 | -0.12 | -0.02 | -0.03 | -0.87 | -0.07 | |
| 65-74 | -0.44 | -0.26 | 0.01 | -0.02 | -1.01 | -0.15 | |
| >75 | -0.59 | -0.51 | -0.08 | -0.11 | -1.17 | -0.22 | |
| Total | -0.26 | -0.09 | -0.06 | 0.01 | -0.67 | 0.02 |
Data source: ESS Round 6 (2012/2013). Post-stratification and population weights applied.
Note: Mean score on each dimension of wellbeing. ‘UK & Ireland’ includes the United Kingdom and Ireland. ‘Scandinavia’ includes Denmark, Finland, Norway, Sweden and Iceland. ‘Southern Europe’ includes Cyprus, Portugal, Spain and Italy. ‘Western Europe’ includes Belgium, France, Germany, the Netherlands and Switzerland. ‘Central & eastern Europe’ includes Estonia, Hungary, Poland, Slovakia, Slovenia, Lithuania and the Czech Republic. ‘South-eastern Europe’ includes Bulgaria, Albania and Kosovo. Israel, Russia and Ukraine did not cluster well within these regions and have been excluded from this analysis.
Differences by income
Figure 3 shows the strength of the correlation between the different wellbeing dimensions and total net household income. We can see that all of the wellbeing dimensions correlate positively with total net household income, except community wellbeing, where the correlation is not significant. This suggests that people with higher total net household incomes tend to report higher scores across the wellbeing dimensions. It is interesting, however, that the extent to which this relationship holds varies across the dimensions, with evaluative wellbeing scores increasing the most as total net household income increases, and vitality scores being less strongly associated with income. In this analysis, no significant relationship (at the 0.05 level) was found between total net household income and the scores that people report in terms of community wellbeing. The lack of an overall correlation between community wellbeing and income across countries may perhaps partly be explained by variation in the relationship between community wellbeing and income across different regions of Europe.
People with
higher total net household incomes
tend to report
higher scores across the wellbeing dimensions
Figure 3: Correlation (0-1) between average score on different dimensions of wellbeing and total net household income
Data source: ESS Round 6 (2012/2013). Post-stratification and population weights applied.
At the regional level, in three of the six regions – Scandinavia, southern and western Europe – we find a weak but nevertheless statistically significant correlation between scores on the community wellbeing dimension and household income. However, whereas this correlation is positive in Scandinavia and western Europe it is negative in southern Europe. This suggests that in Scandinavia (or western Europe), we would expect people with higher household income to report higher community wellbeing scores than the regional average, whilst in southern Europe, we would expect those with higher household incomes to report lower community wellbeing scores than the regional average.
| Emotional wellbeing | Functioning | Community wellbeing | Supportive relationships | Evaluative wellbeing | Vitality | |
|---|---|---|---|---|---|---|
| UK & Ireland | 0.187 | 0.204 | (-0,005) | 0.155 | 0.192 | 0.151 |
| Scandinavia | 0.139 | 0.204 | 0.075 | 0.187 | 0.186 | 0.124 |
| Southern Europe | 0.169 | 0.147 | -0.034 | 0.147 | 0.198 | 0.077 |
| Western Europe | 0.119 | 0.116 | 0.025 | 0.103 | 0.160 | 0.090 |
| Central & eastern Europe | 0.247 | 0.238 | (-0,023) | 0.194 | 0.258 | 0.169 |
| South-eastern Europe | 0.327 | 0.332 | (-0,049) | 0.224 | 0.263 | 0.219 |
Data Source: ESS Round 6 (2012/2013). Post-stratification and population weights applied.
Note: Mean score on each dimension of wellbeing. Correlations shown in parentheses not significant at the 0.01 level (2-tailed). ‘UK & Ireland’ includes the United Kingdom and Ireland. ‘Scandinavia’ includes Denmark, Finland, Norway, Sweden and Iceland. ‘Southern Europe’ includes Cyprus, Portugal, Spain and Italy. ‘Western Europe’ includes Belgium, France, Germany, the Netherlands and Switzerland. ‘Central & eastern Europe’ includes Estonia, Hungary, Poland, Slovakia, Slovenia, Lithuania and the Czech Republic. ‘South-eastern Europe’ includes Bulgaria, Albania and Kosovo. Israel, Russia and Ukraine did not cluster well within these regions and have been excluded from this analysis.
Conclusion
The analysis described here demonstrates the importance of taking a nuanced approach to wellbeing that allows us to differentiate between related but distinct dimensions of wellbeing. We see that scores on the different wellbeing dimensions vary both between countries and between different population groups within countries. Such detailed analysis – made possible by the ESS rotating module on ‘Personal and Social Wellbeing’ – can offer policymakers insight into how best to design effective policy by showing how different determinants influence different wellbeing dimensions. For example, the analysis presented here suggests that, whilst increasing income might help to increase many aspects of wellbeing, in some regions of Europe increasing income seems unlikely to contribute to higher community wellbeing. By shining a light on the experiences of different segments of the population, such analysis can also help policymakers to identify those sections of the population which might benefit most from policies designed to improve wellbeing. For example, the findings presented here suggest there may be value in developing policies to address the tendency towards declining emotional wellbeing and vitality among older age groups.
Michaelson, J., Abdallah, S., Steuber, N., Thompson, S., Marks, N. (2009)
National Accounts of Well-Being. London: New Economics Foundation.
Diener, E., Emmons, R. A., Larsen, R. J., Griffin, S. (1985)
‘The Satisfaction with Life Scale’. Journal of Personality Assessment , 49, pp. 71-75.
Diener, E. and Seligman, M. E. (2004)
‘Beyond Money: Toward an Economy of Well-being‘. Psychological Science in the Public Interest, 5(1), pp.1-31.
Michaelson, J., Abdallah, S., Steuber, N., Thompson, S., Marks, N. (2009)
National Accounts of Well-Being. London: New Economics Foundation.
OECD (2013)
OECD Guidelines on Measuring Subjective Well-being. Paris: OECD Publishing.
Seligman, M. (2011)
Flourish: A New Understading of Happiness and Well-Being – and How to Achieve Them. London: Nicholas Brealy Publishing.
Scrivens, K. and C. Smith (2013)
‘Four Interpretations of Social Capital: An Agenda for Measurement‘. OECD Statistics Working Papers, No. 2013/06. Paris: OECD Publishing
- With a total of about 54,600 respondents
- Where data was pooled together across countries, we used population-adjusted weightings so that respondents from smaller countries did not unduly influence the overall figures for the countries when combined. The downside of this is that respondents from large countries have higher weightings in analysis. We felt uncomfortable including Russia in such analyses because the country’s total population is much higher than any of the other countries in the data set, and respondents from Russia would therefore have a very significant influence on the data. Given that wellbeing in Russia is quite different from that in much of the rest of Europe, we were concerned that including Russia would unduly influence the overall result.
What is a decent society? Europeans’ subjective evaluations
A ‘decent society’ – i.e. one which promotes the wellbeing of its citizens – has a number of different dimensions. The European Social Survey (ESS) is a rich source of data with which to understand the extent to which Europeans think they live in a ‘decent society’.
Introduction
As well as being interested in individual wellbeing, researchers and policymakers are concerned with wider societal wellbeing and how this can be influenced by contextual economic, social, political and environmental factors. The Decent Society Model uses sociological theory to specify what it is that promotes the wellbeing of residents and provides the conditions for all to thrive (Abbot et al, forthcoming). Whether a country can be considered a ‘decent society’ will depend of course on the objective conditions in that country. However, it is also relevant to ask whether countries are perceived by their residents as fit for purpose. The European Social Survey (ESS) is a rich source of data on people’s experiences and beliefs, helping us understand the extent to which Europeans think they live in a ‘decent society’. Data from Round 6 (2012/2013) of the ESS are used here to show how European countries compare with each other in terms of their subjective evaluations of society.
Constructing a Subjective Index of decent society
We have followed the Social Quality approach (Beck et al., 2001; van der Maesen and Walker, 2012) to define what constitutes a ‘decent society’. The Social Quality Model identifies four broad requirements for a ‘decent society’ as shown in Figure 1: economic security, social cohesion, social inclusion and empowerment. The model does not assign priority to any single one of these ‘quadrants’; instead it implies that each of them affects all the others. The indicators used to measure Social Quality and how they are grouped into domains within the quadrants depend on the availability of suitable data across the desired range of countries.
Figure 1: The Social Quality Model
Meet the authors
Pamela Abbott
Honorary Professor of Sociology, University of Aberdeen, UK
Claire Wallace
Professor of Sociology, University of Aberdeen, UK
Roger Sapsford
Honorary Research Fellow, University of Aberdeen, UK
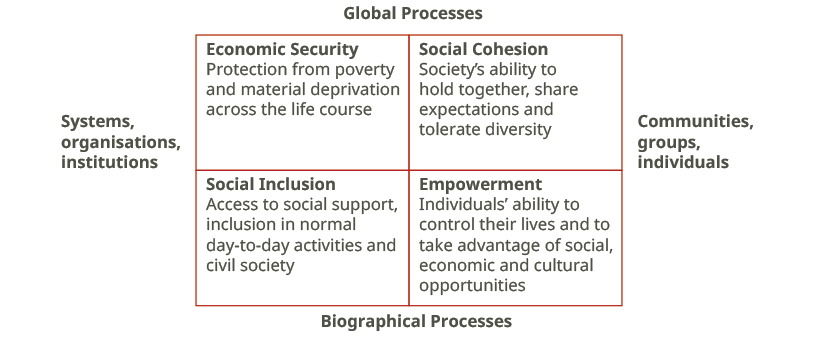
Economic Security is the extent to which individuals can count on having the resources to live a comfortable life and exercise their capabilities throughout the life-course. Often this is measured using objective indicators such as GNI per capita or expenditure on welfare. However, people’s perceptions of economic security are also important. Typically, indicators of economic security are grouped into three ‘domains’: ‘national-level economic statistics’ (the wealth of the country as a whole), ‘the social wage’ (the extent to which all individuals are ‘insured’ against risk across the life-course), and ‘personal economic factors’ (the extent to which some individuals or groups are cut off from income and/or in need).
Social Cohesion is the extent to which the society functions as one body or exhibits harmonious relations between potentially divided sub-factions and the extent to which its constituent groups share norms and expectations or understand each other’s norms and can tolerate diversity. Typical elements are ‘effective and cohesive government’ (e.g. lack of corruption, rule of law – indicators that suggest government is on the same side as the populace), ‘division between groups’ and ability to tolerate minorities and incomers, and ‘personal safety’ (i.e. aspects of the society which mean the individual does not feel threatened by neighbours etc.). Trust is also a very important element of social cohesion – trust both institutional (in government and the major social institutions) and social (in people in general).
Social Inclusion is the extent to which one is part of the society rather than isolated, marginalised or excluded. It starts at the level of individuals, families and communities. Typically the indicators will be grouped into ‘family and friends’ (and the social support they provide), ‘community action and involvement’, ‘religious involvement’ and ‘gender inclusion’ (involvement of women as full citizens). The treatment of age, at both ends of life, may sometimes be a domain as well. In a subjective measure feelings of inclusion and pride in nationality and/or citizenship can be included as indicators of ideological and emotional inclusion.
Conditions for Empowerment covers the ways in which people are empowered to act and the attributes that empower action such as good health and good education. Access to channels of communication, scope for political action, scope for making and acting on choices and belief in the efficacy of one’s actions might figure here.
To construct a Subjective Index of how people perceive their society we selected those questions from ESS Round 6 (2012/2013) which provide indicators of people’s attitudes and evaluations towards the processes or requirements identified for each of the quadrants in Figure 1. We make use of items from the core questionnaire (repeated every round) as well as items from the Round 6 rotating modules on ‘Understandings and Evaluations of Democracy’ and ‘Personal and Social Wellbeing’. Indicators were grouped into ‘domains’ within quadrants on theoretical grounds and using principal component analysis as a guide to clustering.
| Quadrant | Domain | ESS Questions |
|---|---|---|
| Economic Security | National economy | B21 Satisfied with present state of economy in country |
| D26 For most people in country life is getting worse | ||
| Social wage | B24 State of education in country nowadays | |
| B25 State of health services in country nowadays | ||
| Concern with poverty | E29 Government takes measures to reduce income differences | |
| E27 The government protects all citizens against poverty | ||
| Own economic position | F17, F18 Paid work in last 7 days | |
| F42 Feeling about household’s income nowadays | ||
| F38 Any period of unemployment within last 5 years | ||
| Social Cohesion | Trust in other people | A4 Most people try to take advantage of you, or try to be fair |
| A3 Most people can be trusted or you can’t be too careful | ||
| A5 Most of the time people are helpful or mostly looking out for themselves | ||
| Trust in state institutions | B5 Trust in politicians | |
| B6 Trust in political parties | ||
| B2 Trust in country’s parliament | ||
| B7 Trust in the European Parliament | ||
| B22 Satisfaction with how national government is doing its job | ||
| B3 Trust in the legal system | ||
| B4 Trust in the police | ||
| Governance | E17 In country national elections are free and fair | |
| E25 In country the courts treat everyone the same | ||
| Views on immigrants | B30 Allow many/few immigrants of different race/ethnic group from majority | |
| B31 Allow many/few immigrants from poorer countries outside Europe | ||
| B29 Allow many/few immigrants of same race/ethnic group as majority | ||
| B34 Immigrants make country worse or better place to live | ||
| B33 Country’s cultural life undermined or enriched by immigrants | ||
| Social Inclusion | Rights and protection | E23 In country the rights of minority groups are protected |
| B27 Gays and lesbians free to live life as they wish | ||
| C6 Feeling of safety, walking alone in local area after dark | ||
| Active in politics | B14 Worn or displayed campaign badge/sticker last 12 months | |
| B15 Signed petition last 12 months | ||
| B12 Worked in political party or action group last 12 months | ||
| B13 Worked in another organisation or association last 12 months | ||
| B11 Contacted politician or government official last 12 months | ||
| B16 Taken part in lawful public demonstration last 12 months | ||
| Identify with community/ community support | D22 Feel people treat you with respect | |
| D29 Feel appreciated by people you are close to | ||
| D21 Feel people in local area help one another | ||
| D36 Receive help and support from people you are close to | ||
| D27 F eel close to the people in local area | ||
| Socially active | C4 Take part in social activities compared to others of same age | |
| C2 How often meet socially with friends, relatives or colleagues | ||
| C3 How many people with whom can discuss intimate and personal matters | ||
| D1 Involved in work for voluntary or charitable organisations, how often past 12 months | ||
| Involved in church etc. | C14 How often attend religious services apart from special occasions | |
| Empowerment | Political empowerment | E21 The media are free to criticise the government |
| E22 Media provide reliable information to judge the government | ||
| E20 Opposition parties are free to criticise the government | ||
| E28 In country the government explains its decisions to voters | ||
| E19 Different political parties offer clear alternatives | ||
| B23 Satisfied with the way democracy works in country | ||
| B18e How democratic [country] is overall | ||
| Health | C8 Hampered in daily activities | |
| C7 Subjective general health | ||
| Feeling of capability | D3 Feel positive about myself | |
| D2 Always optimistic about my future | ||
| D18 Feel accomplishment from what I do | ||
| D23 Feel what I do in life is valuable and worthwhile | ||
| D16 Free to decide how to live my life | ||
| D35 Have a sense of direction in my life | ||
| D4 At times feel as if I am a failure | ||
| Locus of control | D19 When things go wrong takes a long time to get back to normal | |
| D17 Little chance to show how capable I am | ||
| D30 Deal with important problems in life |
The resulting Subjective Index should be taken as indicative of people’s views only. Combining data from such a large number of indicators means that, cumulatively, there is a considerable number of cases for which there is some missing data, which may distort representativeness.1 Despite those limitations, however, the Subjective Index constructed provides an innovative approach to the detailed measurement of different dimensions of societal wellbeing and an exploration of how complex subjective perceptions of wellbeing vary across Europe.
Findings
Some of the key patterns in ESS respondents’ perceptions of whether their country constitutes a ‘decent society’ according to the Social Quality Model are discussed below.
Perceptions of a ‘decent society’ across Europe
Figure 2 shows the overall scores on the Subjective Index for 28 of the countries that participated in ESS Round 6.2 The country with the highest Subjective Index score – i.e. where people have the most positive views of their society – is Norway, closely followed by the other Scandinavian countries together with Switzerland. At the bottom lies Ukraine, together with most of the other former socialist states of central and eastern Europe. Portugal and Cyprus are also part of this lowest scoring group. In the middle, at or just above the mean, falls the rest of western Europe plus Israel; Germany and the Netherlands score highest within this group, and Italy, Poland, Estonia and Slovenia are at the lower end of the middle grouping.
The absolute levels of scores on the index should not be compared with, for example, scores for happiness or satisfaction in other studies. The Index does not ‘measure’ the ‘amount’ of perceived decency in a society; it is intended to establish a rank-order of the extent to which people see their society as a ‘decent society’.
Another reason that scores should not be interpreted as amounts or percentages of some quantity is that the standard deviation of their distribution around a mean value of 50 is very low. This is because of the underlying correlation between indicators which is a feature of opinion/attitude questionnaires; the scores are computed as the sum of normalised indicators (Mean 50, standard deviation 12), but because of correlation the standard deviation of the composite indicator shrinks each time a set of lower-level indicators is added together. Also, the variation between European countries is actually not very large compared to more global comparisons; including some African countries, for example, would have given a much larger range.
The country with the highest Subjective Index score
i.e. where people have the most positive views of their society is
Norway
Figure 2: Overall Subjective Index scores across Europe
Data source: ESS Round 6 (2012/2013). Post-stratification weights applied.
There is a significant correlation between the Index score and headline indicators of wellbeing such as subjective life satisfaction (ρ=0.58) and happiness (ρ=0.54). However, these headline measures share only a quarter of their variance with the Index. So more is at stake than just whether the country offers a satisfactory life in general; substantial variance remains to be explained even after controlling for happiness/general satisfaction.
As well as variation across countries, there is also variation in people’s perceptions across different sub-groups within countries. Men are significantly more likely than women to experience their society as decent, although the difference between the sexes is small. There are significant and steady increases in positive perceptions as income rises and as education level increases (see Abbott et al. (forthcoming) for more details).
Comparing different quadrants of the Social Quality Model
What is of interest for policy and practice is not only the overall score or ranking, but also how it is made up – which of the different conditions for wellbeing the country is seen to meet by its residents (see Table 2 for scores on each of the four quadrants across countries).
| Overall score | Economic Security | Social Cohesion | Social Inclusion | Empowerment | |
|---|---|---|---|---|---|
| Norway | 55.10 | 57.83 | 56.18 | 52.79 | 53.47 |
| Denmark | 55.01 | 56.69 | 56.44 | 52.59 | 53.78 |
| Sweden | 54.72 | 55.42 | 56.23 | 52.96 | 53.47 |
| Switzerland | 54.12 | 56.60 | 54.44 | 51.24 | 53.45 |
| Finland | 53.90 | 56.09 | 55.46 | 51.58 | 52.03 |
| Iceland | 53.37 | 52.75 | 54.45 | 53.78 | 52.06 |
| Netherlands | 52.97 | 54.43 | 53.97 | 51.05 | 51.98 |
| Germany | 52.23 | 52.20 | 53.32 | 51.67 | 51.31 |
| Israel | 51.61 | 50.09 | 51.57 | 51.81 | 52.48 |
| Belgium | 51.58 | 52.23 | 51.70 | 50.26 | 51.39 |
| UK | 51.39 | 53.51 | 51.25 | 49.81 | 50.72 |
| Ireland | 51.39 | 51.01 | 50.20 | 50.58 | 52.85 |
| France | 50.02 | 50.27 | 49.88 | 50.07 | 49.75 |
| Poland | 49.85 | 47.91 | 49.34 | 50.81 | 50.43 |
| Slovenia | 49.56 | 49.57 | 50.58 | 47.82 | 48.98 |
| Estonia | 49.50 | 48.41 | 48.76 | 49.79 | 49.76 |
| Italy | 49.31 | 47.99 | 46.84 | 51.05 | 51.18 |
| Cyprus | 48.80 | 49.38 | 47.74 | 48.11 | 49.52 |
| Slovakia | 48.72 | 47.88 | 47.09 | 49.64 | 49.68 |
| Czech Republic | 48.60 | 46.98 | 47.85 | 50.45 | 48.57 |
| Lithuania | 48.45 | 47.53 | 49.01 | 47.75 | 48.59 |
| Hungary | 48.33 | 48.57 | 48.32 | 47.86 | 48.19 |
| Albania | 48.17 | 45.81 | 45.78 | 50.06 | 50.08 |
| Portugal | 47.96 | 45.76 | 46.04 | 49.25 | 49.20 |
| Russia | 47.82 | 46.33 | 46.76 | 48.57 | 48.35 |
| Kosovo | 47.09 | 47.40 | 45.79 | 47.37 | 46.90 |
| Bulgaria | 46.97 | 43.31 | 45.21 | 49.70 | 48.37 |
| Ukraine | 46.03 | 44.72 | 44.59 | 48.13 | 46.11 |
Data source: ESS Round 6 (2012/2013). Post-stratification weights applied.
Note: The shading of the table cells corresponds to the score grouping (> 53, 49-53, < 49) presented in Figure 2
Figure 3 demonstrates that countries vary in terms of their relative scores on the four quadrants of the Social Quality Model. Results for different quadrants can be displayed by selecting or deselecting them in the legend.
Figure 3: Scores for the four quadrants of the Subjective Index by country
Data source: ESS Round 6 (2012/2013). Post-stratification weights applied.
Note: Scores are expressed in terms of deviations from the whole sample quadrant mean.
Norway, Denmark and Sweden rank high across all four quadrants. Switzerland and Finland perform well in terms of Economic Security and Social Cohesion in comparison to most other countries but score relatively low in terms of Social Inclusion. Iceland, on the other hand, scores relatively low on Economic Security and Empowerment but high on Social Inclusion. Residents in Germany, Israel, Italy, the Czech Republic, Albania and Bulgaria rate Social Inclusion in their countries higher than any of the other dimensions.
The correlations between a country’s score on the overall Subjective Index and individual quadrant scores are high and significant (Table 3). It is notable however that the correlation with Social Inclusion is noticeably lower than for the other three quadrants. There are also significant and reasonably strong correlations between each of the four individual quadrants, although again the correlation between Social Inclusion and the other three quadrants is noticeably lower. Whilst there is a strong element of ‘general approval’ across different aspects of society – scores on one quadrant are fairly predictive of scores on the others at the country level – Social Inclusion appears to be evaluated differently (sometimes better, sometimes worse) to other aspects of a ‘decent society’ in many countries. Further work is needed to understand why this might be the case.
| Overall Index | Economic Security | Social Cohesion | Social Inclusion | Empowerment | |
|---|---|---|---|---|---|
| Overall Index | 1 | ||||
| Economic Security | .960** | 1 | |||
| Social Cohesion | .978** | .950** | 1 | ||
| Social Inclusion | .828** | .670** | .755** | 1 | |
| Empowerment | .930** | .840** | .849** | .854** | 1 |
Data source: ESS Round 6 (2012/2013). Post-stratification weights applied.
Note: ** indicates correlation significant at p<0.01 level
‘Drilling down’ further beyond the four quadrants, it is possible to analyse which of the constituent domain scores making up each quadrant are having most effect on overall perceptions of a ‘decent society’ and which individual indicators are important. For example, many of those countries which rank lower on Social Inclusion than we might expect given their overall ranking (Norway, Denmark, Sweden, France, UK) have relatively low rates of self-reported church attendance whilst other countries which perform relatively well in terms of Social Inclusion compared with their overall ranking (Ukraine, Bulgaria) are distinguished by relatively high rates of church attendance. This suggests an interesting area for further research – the church may be promoting social inclusion and welfare where this function is not taken on by governments. Our data suggest, however, that a low rate of church attendance may be partly compensated by high social activity/involvement in France and by high level of tolerance of minority groups in the UK. Low levels of political inclusion, on the other hand, appear to decrease the overall national Social Inclusion score (e.g. in Portugal and Cyprus) despite the relatively high rate of church attendance.
Conclusion
The ESS provides valuable insights into what constitutes a ‘decent society’ by allowing us to construct detailed measures of the extent to which people perceive their society to be a decent one and to explore how these perceptions vary across countries. In combination with more objective indicators on how far the conditions in a country meet the requirements for a ‘decent society’, such insights can offer potentially useful guidance to policymakers seeking to identify what aspects of their political and social regime may be in need of reform in order to promote citizens’ wellbeing.
For a more detailed discussion of how to conceptualise and evaluate the ‘decent society’ – including details of a complementary index to the one presented here, based on more objective indicators – please see our forthcoming book:
Abbott, P., Wallace, C., Sapsford, R. (forthcoming)
The Decent Society. London: Routledge.
Abbott, P., Wallace, C., Sapsford, R. (forthcoming)
The Decent Society. London: Routledge.
Beck, W. A., Thomese, F., van der Maesen, L.J.G., Walker, A. C. (ed) (2001)
Social Quality: A Vision for Europe. The Hague: Kluwer Law International.
Van der Maesen, L.J.G., Walker, A. (ed) (2012)
Social Quality: From Theory to Indicators. Basingstoke: Palgrave Macmillan.
- Missing data on individual indicators is distributed across countries and in most cases is relatively low – below 5% – with some exceptions e.g. the indicator ‘Trust in European Parliament’ (11% missing data) or such domains as ‘Trust in state institutions’ (15% missing data) and ‘Political freedom’ (13% missing data). The cumulative effect of some missing data on each of the individual indicators, means that once the different indicators and domains are combined to build up the four quadrants, around 40% of the total sample are excluded from the analysis. This is a common problem when constructing multidimensional indices. As certain groups of respondents might be more inclined to item non-response than others, their exclusion from analysis may lead to bias that should be addressed in future research.
- Spain is excluded from our analysis. We were unable to construct the social inclusion quadrant for Spain because of completely missing data on one question.